

1. Introduction
Composite materials have gained more importance than conventional materials because of their high strength to weight ratio and low-cost features. Therefore, these materials become preferable for the design of structural applications and are being used in different industries such as aircraft, automobile, and sporting goods. Generally, the holes are generated in composite structures to connect them with the primary structures by rivets and bolts. However, the presence of these holes reduces the strength of the composite structures due to the considerable increase in stress concentration. Therefore, it is essential to evaluate the residual strength of notched composites. Modeling of notched composites is quite complicated as it involves multiple damage modes such as in-plane failure(matrix and fiber failure), delamination(Shon and Kim, 2015), and debonding damage between fiber and matrix(Achard et al., 2014).
During the past few years, different numerical studies(Jung and Kim, 2016) and experimental techniques(Bezawit et al., 2018) have been developed for the characterization of composite structures. Green et al.(2007) have performed the experimental tensile test series on notched composite laminates for carbonepoxy composite laminates. Further, the authors studied the thickness size effect and found out the tensile strength of the composite plates decreased with the increase in specimen size and also observed the different failure modes such as delamination, pull out and matrix cracking in a specimen of different sizes and lay-ups. Camanho et al.(2007) introduced the numerical model based on continuum damage mechanics by using the shell elements and simulated the in-plane size effect that was in good agreement with the experimental results. Hallet et al.(2009) used a cohesive zone approach to model delamination failure. Chen et al.(2013) predicted the tensile strength of notched composite laminates and developed a smear crack model for the matrix cracking and cohesive zone model for the delamination failure. The failure modes in notched composite laminates are mainly divided into two types that are an in-plane failure (ply failure) and delamination failure. To correctly predict the ultimate strength of composite structure, an accurate model is required that incorporates all the damage modes such as matrix cracking, fiber breakage and matrix fiber debonding. Some of the complex damage models available in literature rely on the continuum damage mechanics to correctly model in-plane and intralaminar damage modes. There are different failure criteria used in the literature such as Tsai-Hill and Tsai-Wu that are only capable of identifying the failure of material point and are unable to influence that failure on the degradation of material stiffness. On the other hand, Hashin failure criteria is well developed with different failure modes for fiber, matrix and shear damage. Each failure mode is associated with a distinct failure index that is defined by a function of ultimate stresses, thus predicting the initiation and progression for the in-plane failure. Camanho et al.(2007) did not consider the delamination in his model, thus resulting in the inaccurate strength predictions of the notched composite laminate. Most recently, cohesive zone modeling by using cohesive elements in ABAQUS is being used to predict the mechanical response and failure behavior of the composite structures and proven to be the reliable approach for modeling delamination failure. Therefore, in this study, the combination of Hashin damage model and cohesive zone elements is used to predict the correct failure modes and strength prediction of the notched composite laminates.
In this study, the main objective is to develop a progressive damage model that accounts in-plane failure as well as delamination and debonding damage between the fiber and matrix. In-plane damage modeling is done by using ABAQUS built in damage material model(hashin failure criteria). Delamination modeling is carried out by using cohesive zone approach. The significance of this study as compared to previous studies is that it presents the complete progressive failure of the composite laminate in various damage modes, as discussed in the next section. The results of the study are compared with the previous experimental and numerical studies.
2. Description of Numerical model
This section includes the complete details of the finite element model developed by using commerical software package ABAQUS. Explicit dynamic analysis is carried out for a notched rectangular composite plate with a uniaxial tensile load applied at the one end.
2.1 Details of Finite element model
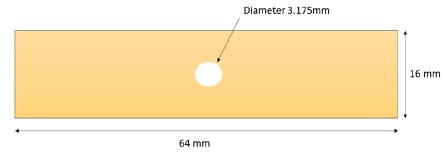
The complete geometry and boundary conditions are similar to those used in the experimental setup carried out by Green et al.(2007). Carbon fiber-epoxy composite having rectangular geometry with a hole diameter of 3.175mm is used in this study. The total thickness of the laminate is 1mm. The geometry of the test specimen is shown in Fig. 1 Due to the symmetric geometry of the plates, axis-symmetric boundary conditions were employed that reduces the computational time to obtain the finite element solutions. Each ply and interface layer were meshed using continuum shell element(SC8R), and the cohesive elements(COH3D8) with the 0.125mm ply thickness. The mesh is kept uniform with the element size of 0.25mm. There is a total number of eight plies and seven interfaces(cohesive element) layers inserted between the plies as shown in the Fig. 2.

2.2 Material Properties
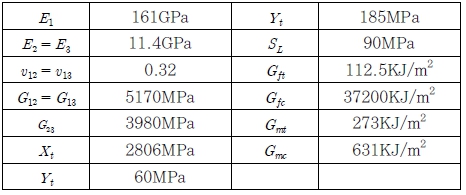
The Material properties of each ply of IM7/8552 carbon-epoxy composite laminate are given in Table 1(Chen et al., 2013). Table 2 presents the mechanical properties of the interface layer(Hallett et al., 2009).

2.3 Failure Criteria
As discussed earlier, notched composites exhibit a wide variety of failures modes. Therefore, proper failure criteria are needed that accounts for all the damage modes in the notched composite structures. ABAQUS built-in material model(hashin damage model) is used in this study for modeling laminate failure and delamination is modeled by using cohesive elements. These damage models are discussed in detail in the following subsections.
2.3.1 Hashin Failure Criteria
The Hashin(1980) damage model uses a homogenized representation of a lamina and identifies four failure modes. These four failure modes are fiber tension, fiber compression, matrix tension, and matrix compression failure.
Damage Initiation
The four failure modes of damage initiation are shown in the below mentioned equations(Simulia, 2012).
Fiber tension ()
Fiber compression ()
Matrix tension ()
Matrix Compression ()
are indexes which shows whether the criterion for damage initiation in a damage mode has been satisfied or not. Damage initiates when any of the indexes surpasses the value of 1.0. The output variables assigned for damage initiation are HSNFTCRT, HSNFCCRT, HSNMTCRT, and HSNMCCRT.
Damage Evolution
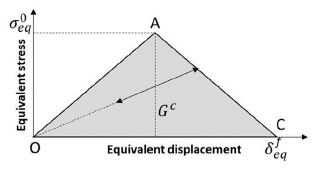
Fig. 3 describes the process of damage evolution (Simulia, 2012). Damage initiates at point A, and the line OA represents the linear elastic increase in stress up to the point A. Once the damage begins, the stress values starts to decrease until it reaches the zero value. The area under the curve exhibits the fracture energy.
The equations from (5) to (12) are used to calculate the equivalent stress and the equivalent displacement.
Fiber tension ()
Fiber compression ()
Matrix tension ()
Matrix Compression ()
Here the 〈 〉 bracket set describes the Macaulay bracket operator. Lc is the critical length, which is introduced in the simulation to minimize the mesh dependency problem. The output variables assigned for damage evolution are: DAMAGEFT, DAMGEFC, DAMAGEMT, and DAMAGEMC.
2.3.2 Cohesive Law
The cohesive elements are generally used for modeling delamination failure, which enhances the accuracy of the finite element simulation. The damage model is described in terms of the separation-traction law that has both damage initiation and damage propagation stages(Simulia, 2012). Penalty stiffness matrix, as shown in equation (13), presents the linear elastic response. Here Knn, Kss and Ktt are the penalty stiffnesses in normal and shear directions. Nominal stress {t} represents the traction and separation is expressed by the nominal strains {ε} across the cohesive elements. Here tn denotes the normal stress, ts and tt are the shear stress components perpendicular to the normal stress.
Damage Initiation
Maximum nominal stress criterion integrated with traction-separation law is used for damage initiation.
Damage Evolution
Energy based damage evolution is used in this study that employes energy release rates. BK(benzeggagh Kenane) is the most popular energy-based criterion as shown in equation 15.
whereas the GIc and GIIc are the critical energy rates in mode I and mode II and η is the material insensitivity.
3. Numerical results and discussion
In this section, the results of the numerical simulation are discussed in detail. Progressive damage analysis is carried out on all lamina orientations, i.e., 0°, 45°, -45°, and 90° angles. The significance of this study as compared to previous studies is that it presents the complete details of the damage initiation and progression of each ply in different damage modes such as described earlier in Hashin Failure criteria(fiber tension failure, fiber compression failure, matrix tension failure, and matrix compression failure).
3.1 Damage initiation
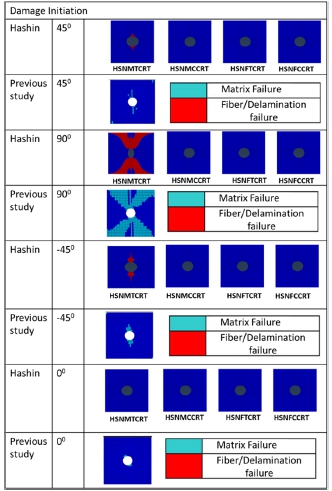
Damage initiation and the progression in the ply is characterized by using the inbuilt damage material model Hashin Failure criterion in the ABAQUS. The output variables assigned for the damage initiation are HSNMTCRT, HSNMCCRT, HSNFTCRT, and HSNFCCRT for the matrix and fiber failure in both tension and compression modes. These are the failure indexes, which shows whether the criterion for the damage initiation has been satisfied or not. Damage initiates when any of the indexes surpasses the value of 1. Fig. 4 shows the damage initiation plots of all the laminae oriented at 0°,45°, -45°and 90° angles in different failure modes and a comparison with the previous study(Chen et al., 2013). Chen et al.(2013) developed a smeared crack model for matrix cracking and cohesive elements for delamination failure and predicted the correct failure modes; however, it was found not suitable for accurate strength predictions for laminates failed by delamination. The red color in the plots of the current study(hashin damage model) shows the degraded area, whereas the blue color represents the undamaged area. Whereas in Chen's model, the matrix cracking is shown in green color and delamination damage and fiber failure are illustrated in the red color. Damage initiates in the 45° ply due to the matrix cracking, while the rest of the failure modes have no contribution to the damage initiation of 45° ply. Upon comparison with the previous study, the damage mode and damage pattern shows a similar trend. 90° ply exhibited the maximum damage among all plies as the load was applied transversely to the fiber direction. Similarly, -45° ply is only influenced by the matrix tension failure, and on the other hand, 0° ply showed the least damage among all plies.
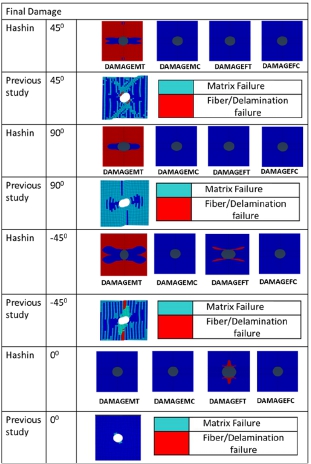
3.2 Final Damage
Fig. 5 shows the final plots of all the plies oriented at 0°, 45°, -45° and 90° angles in different failure modes and a comparison with the previous numerical model(Chen et al., 2013). For the damage evolution case, the output variables assigned in the ABAQUS are DAMAGEFT, DAMGEFC, DAMAGEMT, and DAMAGEMC, thus predicting the final damage of the notched composite laminate. The first failure observed in the composite laminate is the matrix cracking around the hole boundary in 45°, 90° and -45° ply in the longitudinal direction due to the tensile loading except for 0° ply. In 90° ply, the load was applied transversely to the fiber direction; thus, matrix dominant failure mode was mainly observed in that ply. On the other hand, in 0° ply, the load was applied in the direction of fiber; thus, no matrix cracking was seen, and the fiber failure was mainly observed. The same trend in terms of damage pattern and damage modes was observed when compared to the previous numerical study.
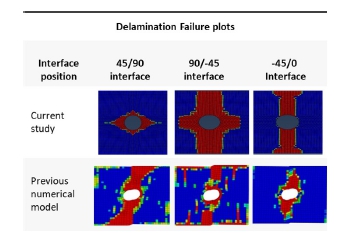
3.3 Delamination
Delamination plots computed in the numerical simulation were compared with the previous finite element simulation and found, as shown in Fig. 6. The red colour indicates the most delaminated area and, the blue colour shows the undamaged area in the plot. In this work, the ABAQUS cohesive element is used for modeling delamination modeling. Delamination modeling using a cohesive element is very sensitive to the element size, and the element size must be small enough to capture the stress gradient in the wake of cracks. The delamination plots are plotted for the three interfaces that are 45°/90°, 90°/-45° and -45°/0° ply and are compared with the previous study. Red color shows the maximum delaminated area, and the rest of the colors shows the least affected area. The result of the 45°/90° interface shows underprediction of the delamination onset. It could be due to the fact that the ply element size is too large to capture the stress concentration around the hole leading to underprediction of the stress at the hole edge which delays the initiation of the failure. On the other hand, 90°/-45° and -45°/0° almost shows the similar delamination pattern exhibiting the vertical delaminated area around the hole.
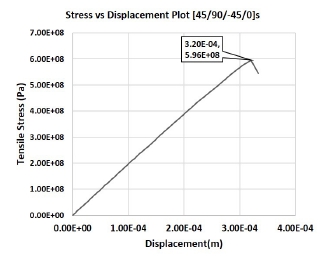
3.4 Open-hole tensile strength
Fig. 7 illustrates the stress versus displacement curve. Open-hole tensile strength of 596MPa is computed from the stress-displacement curve.
Mesh convergence study is performed for four different in-plane mesh sizes as shown in the Fig. 8 to determine the accuracy and reliability of the numerical model. Convergence criteria is set to be achieved, until the percentage difference between the two mesh sensitivity tests is less than 0.5 percent. The open hole tensile strength is calculated for each mesh size until the convergence criteria is fulfilled. Fig. 9 shows the open hole tensile strength values computed for each mesh size case and the percentage difference plot between the two successive test cases. It is observed that the convergence is achieved at the Mesh 3 case with the element size of 0.25mm, which is used in the current numerical study.
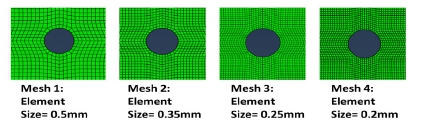
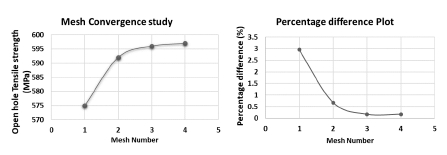
Fig. 10 presents the comparison between previously published experimental and numerical studies with the current progressive damage model(Green et al., 2007;Chen et al., 2013). Classical laminate theory only simulates the in-plane response. Therefore, it deviates widely from the experimental results. On the other hand, neglecting the delamination in the numerical model will lead to overestimation on the predicted tensile strength. Chen’s model and the present study are much closer to the experimental tensile strength. The current study provides the complete detail of the damage modes as well as accurately predicts the open-hole tensile strength.
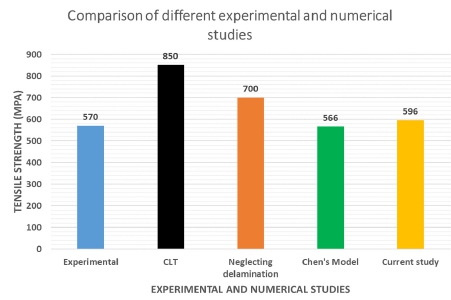
Fig. 10
Comparison of open-hole tensile strength with previous experimental and numerical studies(Green et al., 2007;Chen et al., 2013)
4. Conclusions
The progressive damage model was developed for an open-hole tensile test by using a carbon-epoxy composite laminate with a quasi-isotropic lay-up. The damage model provides a complete detail about the in-plane as well as delamination damage in a composite plate. ABAQUS built-in material model (hashin damage) was used for modeling laminate failure, and delamination damage was modeled by employing a layer of cohesive zone elements. Damage due to the matrix tension failure dominated in both damage initiation and damage evolution, whereas, fiber damage only occurred in 00 ply. Moreover, it was observed that neglecting the delamination led to an overestimation on the predicted tensile strength. The open-hole tensile strength was in good agreement with the previous published numerical and experimental studies. In the future, the present progressive damage model can be extended to study the thickness size effect on the strength of notched composite laminates.
