

1. Introduction
2. Analytical Model
2.1 Material and model
2.2 Validate the proposed model
3. Simulation model of 72m UHPFRC box girder
3.1 Overview of Busan pedestrian bridge
3.2 Finite element model description
3.3 Analytical resut
4. Conclusion
1. Introduction
Ultra High Performance Fiber Reinforced Concrete(UHPFRC) is widely known as an advanced concrete material, which has been developed for over 30 years. Due to the stringent ingredient requirements, UHPFRC possesses superior characteristics to conventional concrete. UHPFRC exhibits high strength in compression and tension. Furthermore, UHPFRC shows high ductility, impact resistance, fatigue resistance, durability, and high resistance to aggressive media(Yoo and Banthia, 2017). Y.L. Voo revealed that there are more than 200 bridges using UHPFRC as the main bearing structure or the supported parts(Voo et al., 2017). Among them, there are many pedestrian bridges.
According to the review, although the literature on numerical modeling of flexural behavior of UHPFRC is abundant, there is only a handful publication on the large-scale simulation of UHPFRC girder. Simulation models of three different UHPFRC pre-stressed I-girders and four pre-stressed pi-girders were investigated in ABAQUS by Chen.L et al. The length of I-girder is 24.4m, 7.3m, and 9.2m while the span of the pi-girder is 7.6m, respectively(Chen and Graybeal, 2010). The simulation result of UHPFRC girder using CDP model was compared to concrete smeared cracking model to obtain the appropriate model to capture nonlinear of UHPFRC girder. Based on the linear complementary problem(LCP), which is classified under discrete-cracking model, Guo and Han investigated the numerical simulation applicability to analyze failure surface of UHPFRC-I girder. The comparison between fracture simulation LCP and test result has a similar tendency demonstrated the reliability and effectiveness of this approach(Guo and Han, 2014). Gang Zang et al. developed the series of finite element(FE) to optimize the cross-section of pi-girders and combine with mechanical properties of UHPFRC over span lengths up to 41.1m. The simulation models in ABAQUS were validated by test results. A series of the effective cross-section for UHPFRC pi-girders were designed for spans ranging up to 41.1m(Zhang and Graybeal, 2015). Baochun Chen et al. implemented an experimental and numerical study on a 30M UHPFRC box girder. The FE analysis was performed by ABAQUS software and the simulation model shows good agreement results with the test(Chen et al., 2018).
Based on the literature survey, more experimental and finite element studies on large-scale girders are needed to obtain well- fitted constitutive models both of compressive and tensile nonlinear behavior of the UHPFRC girder. The objective of this study is to simulate the structural behavior of UHPFRC post-tensioned 72m box girder which composes five segments, applied for a pedestrian bridge in Busan, South Korea. According to the data that the author has collected, this pedestrian bridge will possess the longest span girder in the world without the use of supporting structures such as cable-stayed or steel frame. Another remarkable aspect is the thin web and thin deck plate of the box girder has no reinforcement in the longitudinal and transverse direction, which can significantly reduce the complex installation of rebars. The results of FE is validated by experiment of a 50m UHPFRC pre-stressed box girder(Makhbal et al., 2018). This study contributes to the understanding of the whole model and their connection details to enable simulate properly the nonlinear behavior of super long span UHPFRC pre-stressed box girder.
2. Analytical Model
2.1 Material and model
Concrete damaged plasticity(CDP) model is one of the most suitable to capture the non-linear behavior of concrete material. Two basic damage mechanisms of concrete including tensile cracking and compressive crushing are successfully described through the CDP model. Furthermore, reduction stiffness of material due to damage for tension and compressive strength is independent. Due to its advantages, the CDP model has been chosen to simulate the behavior of UHPFRC material in the present study. The theory and formulas of the CDP model can be referenced in the literature(Lee and Fenves, 1998; Lubliner et al., 1989). In ABAQUS, the CDP model is implemented by parameters including the ratio of biaxial compressive strength to uniaxial compressive strength sbo/sco, the shape of the failure surface kc, dilation angle f, eccentricity є, the viscosity parameter, and constitutive law of UHPFRC material(Dassault Systèmes Simulia Corp, 2016). Table 1 lists the parameters of the CDP material model.
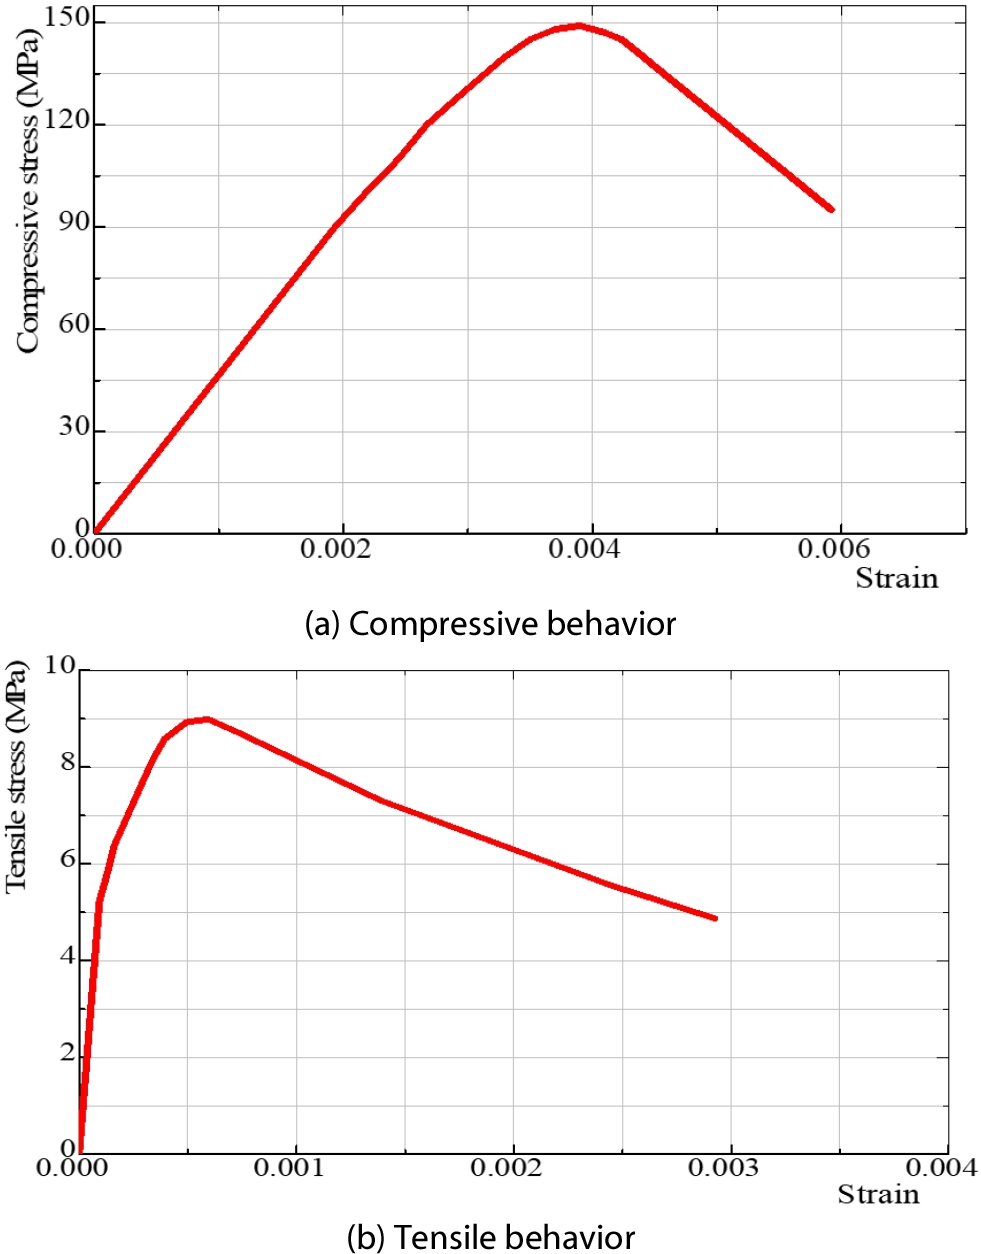
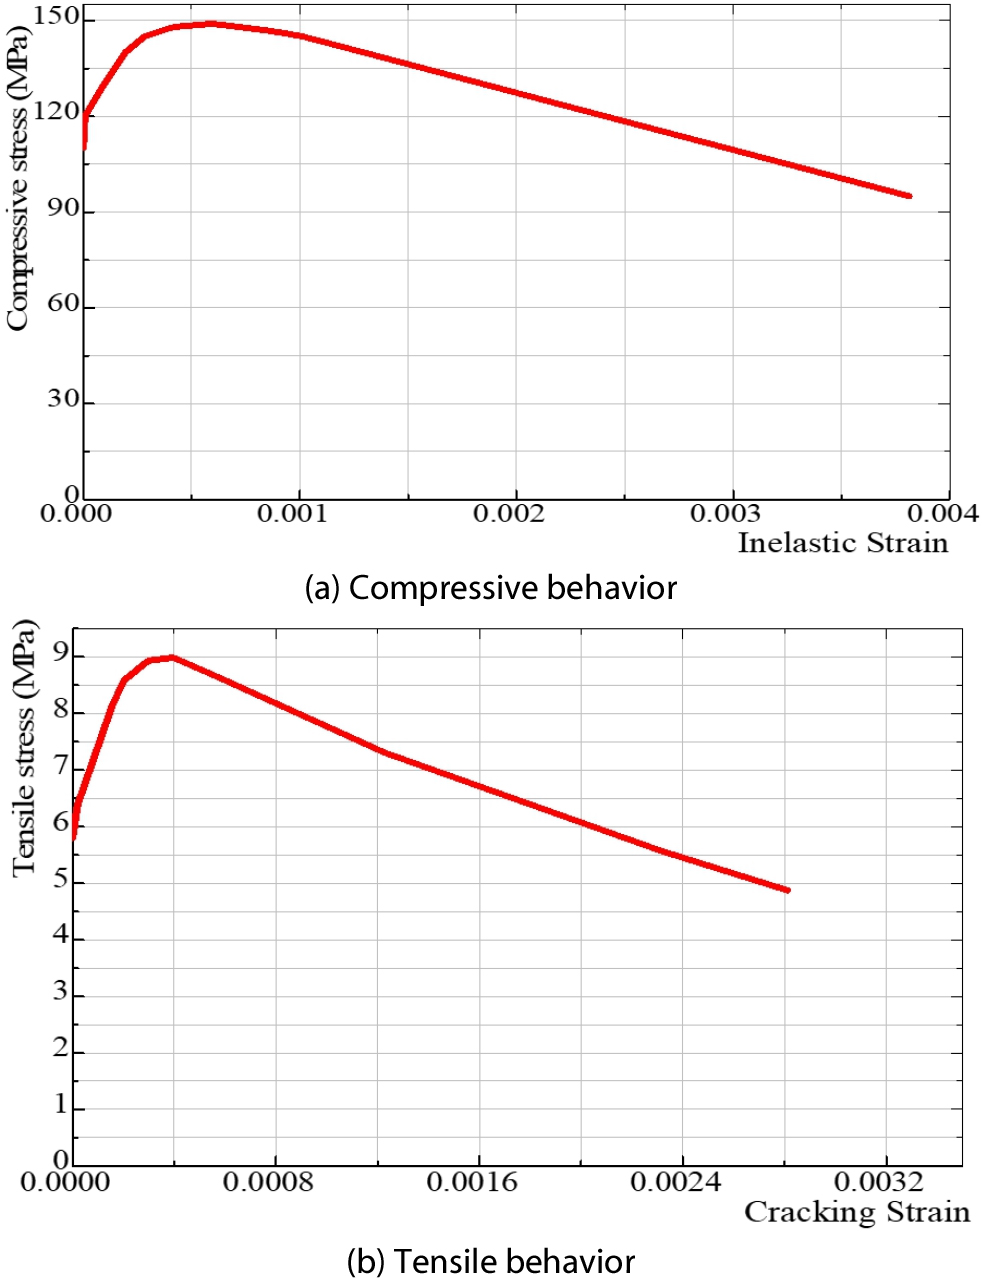
Fig. 1 shows the relation of stress-strain of 150MPa UHPFRC material obtained from the tests. The modulus Ec= 45082MPa of UHPFRC material can be calculated from this stress-strain curve. Fig. 2 depicts the stress-inelastic strain curve in compression and stress-cracking strain in tension for UHPFRC material obtained from data in Fig. 1. These calibrated curves are utilized to simulate the structural behavior of the UHPFRC pre-stressed box girder in the next section.
Table 1
Input parameters of CDP model for UHPFRC
| Curbach and Speck(2008) | 1.07 | |
| Kmiecik and Kamiński(2011) | kc | 2/3 |
| Bahij et al.(2018) | 𝜙 | 36(0) |
| Bahij et al.(2018) | 𝜖 | 0.1 |
| Da Silva(2004) | viscosity | 0.005 |
2.2 Validate the proposed model
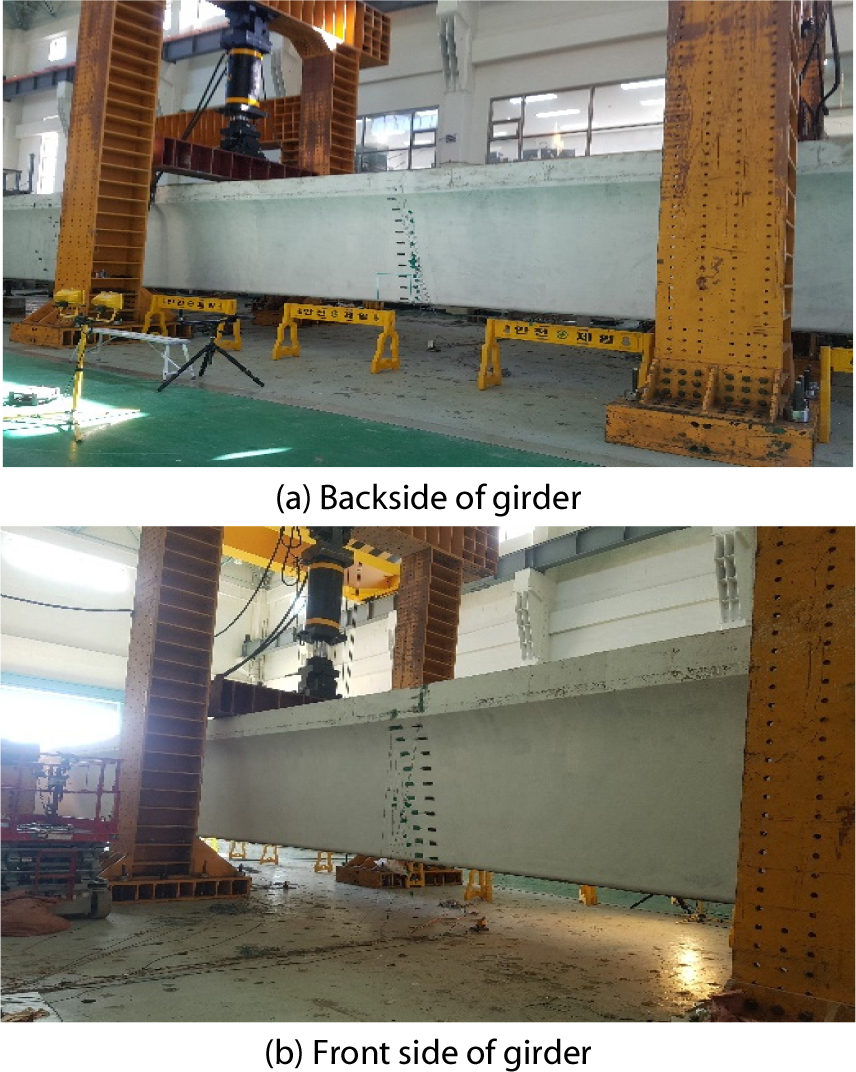
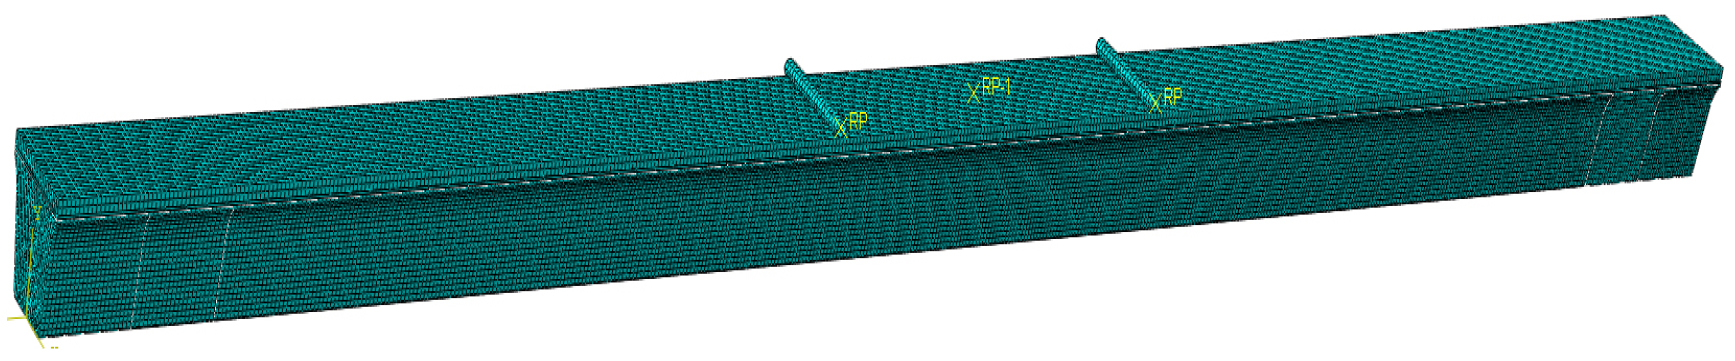
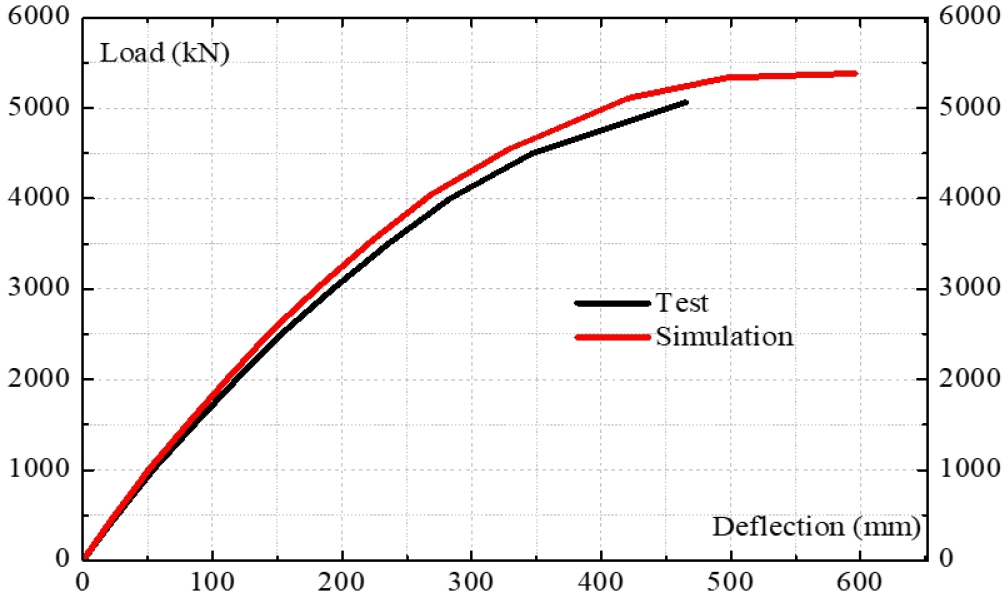
In this section, the simulation model of 50m UHPFRC pre-stressed box girder is verified by comparing results with the test. Later on, the validated simulation model will be utilized to analyze the 72m UHPFRC box girder. 50m UHPFRC pre-stressed box girder composes three U-shaped segments with 50mm thickness deck plate, reinforced high strength concrete(HSC) 35MPa slab with 240mm thickness. The full scale four-point bending test on UHPFRC box girder is conducted in Structural Engineering Laboratory of KICT(Korea Institute of Civil Engineering and Building Technology)(Makhbal et al., 2018). Fig. 3 shows the edge and mid section of 50m UHPFRC pre-stressed girder. Figs. 4 and 5 depict the four point bending test of girder and simulation mesh model in ABAQUS. The load is applied vertically in the plane of strong axis of box girder. The loading increases until the value of 5048KN, which corresponding to the appearance of major cracks in girder, then the test is stopped. Fig. 6 presents the prediction load-displacement curve at the mid-span of the UHPFRC box girder according to the simulation and the test. In the simulation result, the failure load occurs at 5334KN corresponding to the displacement 493.5mm. In the test, the corresponding deflection to the peak load of 5048kN is 465.8mm. The disparity of peak load and deflection between simulation and test result is 5.3% and 5.6%, respectively.
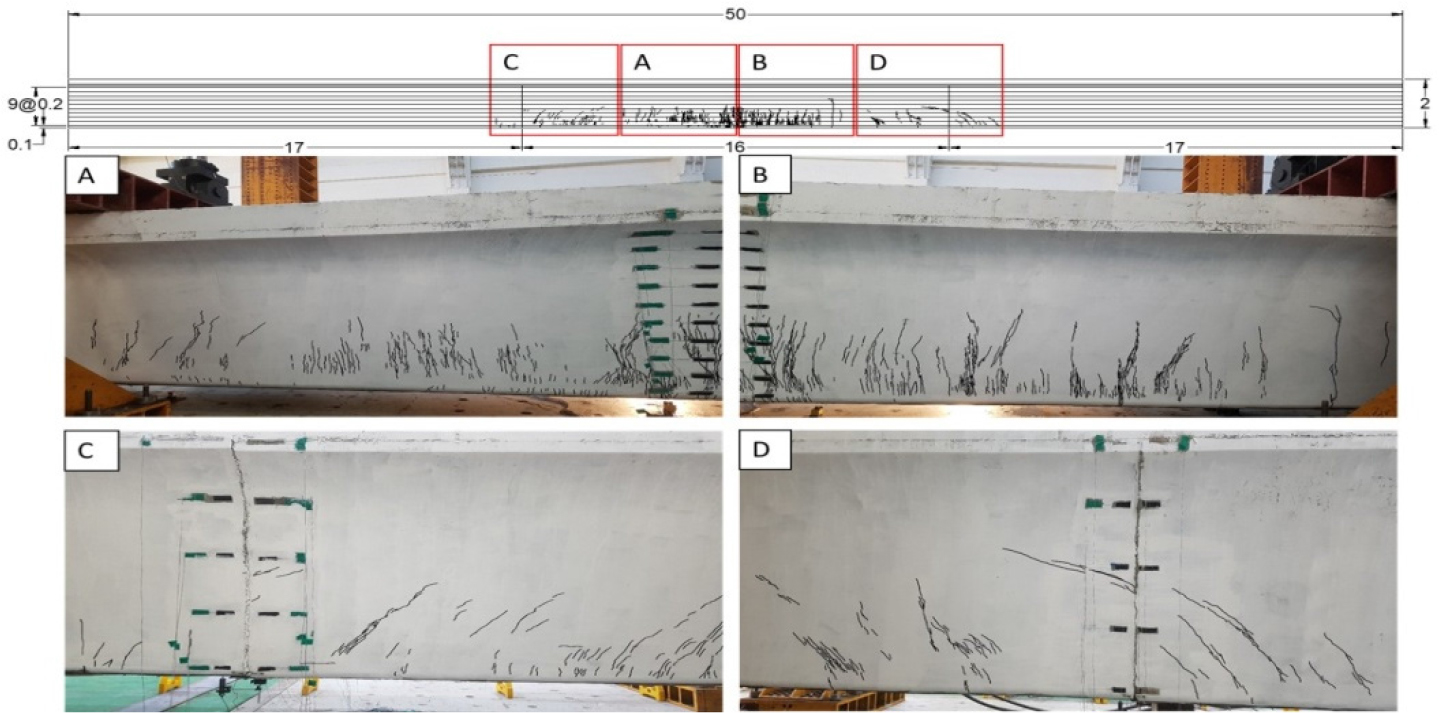
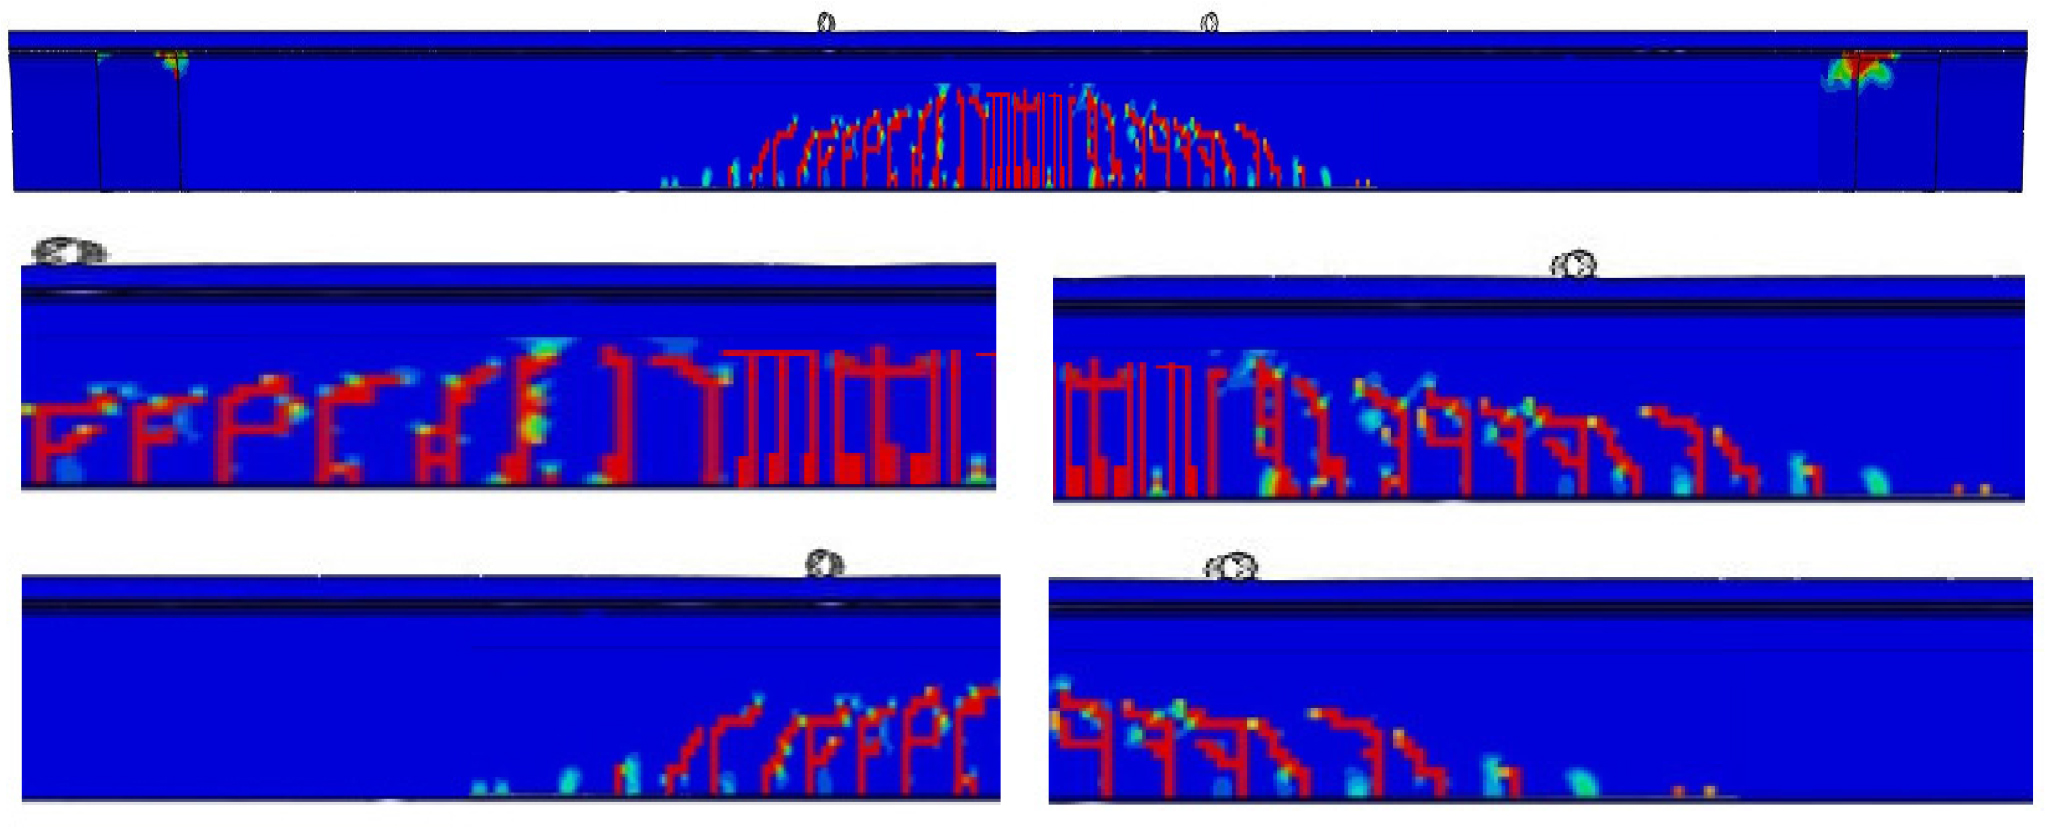
Failure Mode and Cracking Pattern: In the test of 50m UHPFRC pre-stressed box girder The first cracks were observed at 2500 KN load level. When the applied load increased, the number of visible cracks propagated rapidly and extended through the depth of the cross-section. After stopping the bending test over 5048KN load level, the cracks were highlighted by a black pen. A larger number of hairline cracks can be observed at the mid-span of the girder. The general direction of cracks is perpendicularly from bottom to center of girder at constant moment region. The crack distribution of the girder according to the test and simulation result is shown in Figs. 7 and 8. As a qualitative observation, It can be seen that compared to the experiment, numerical simulation has shown well-fitted results.
3. Simulation model of 72m UHPFRC box girder
3.1 Overview of Busan pedestrian bridge
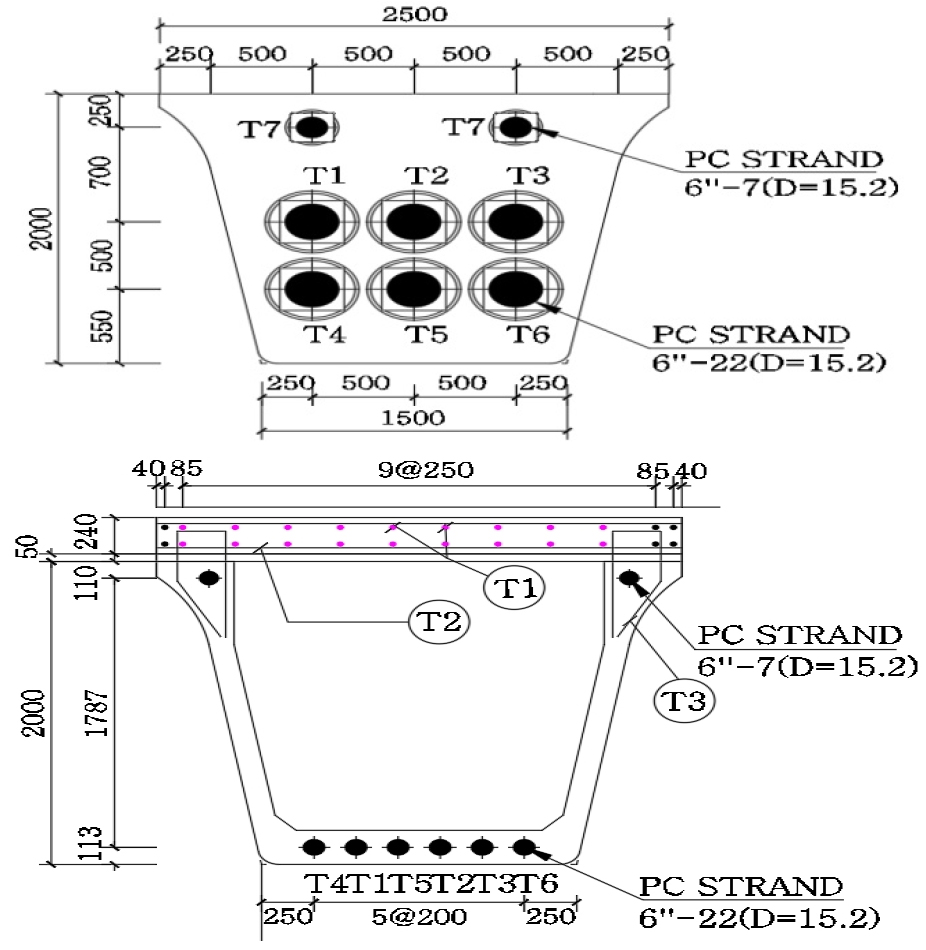
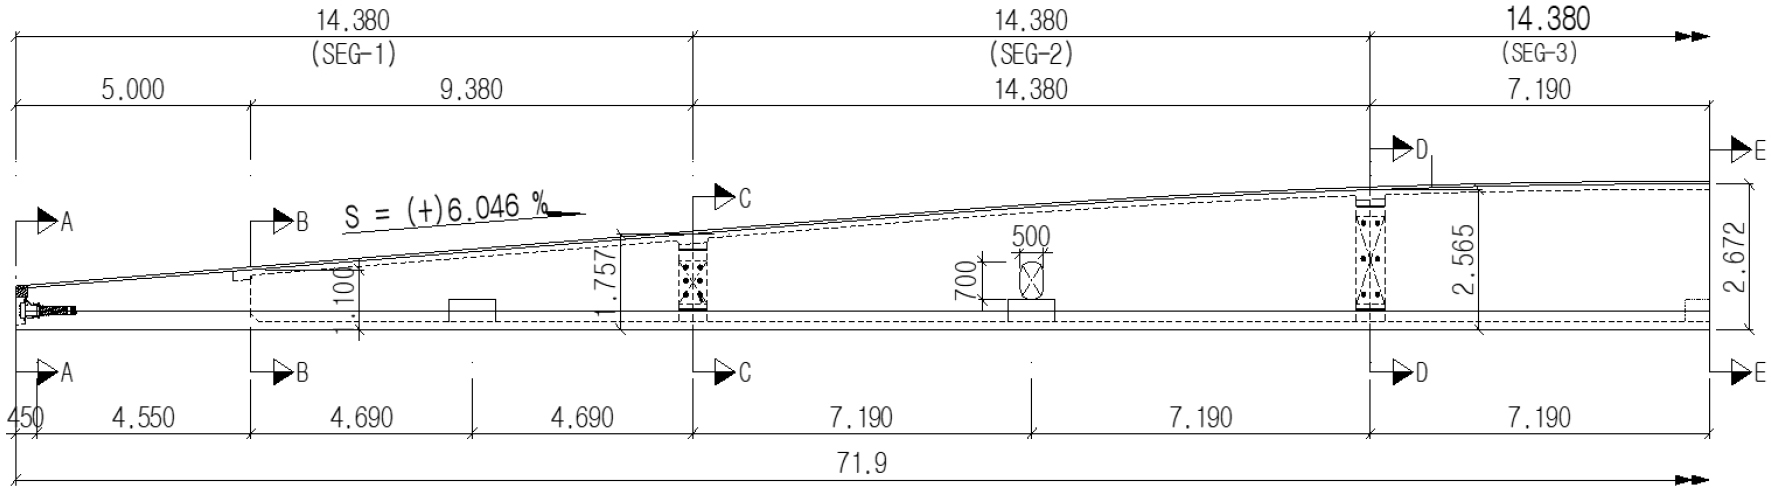
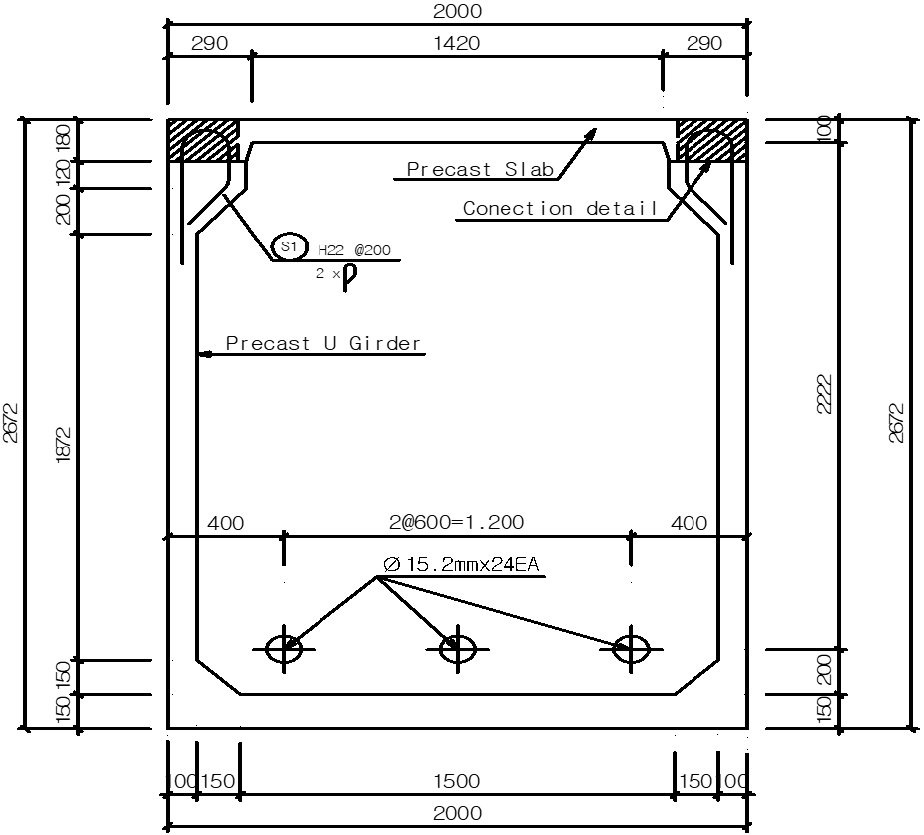
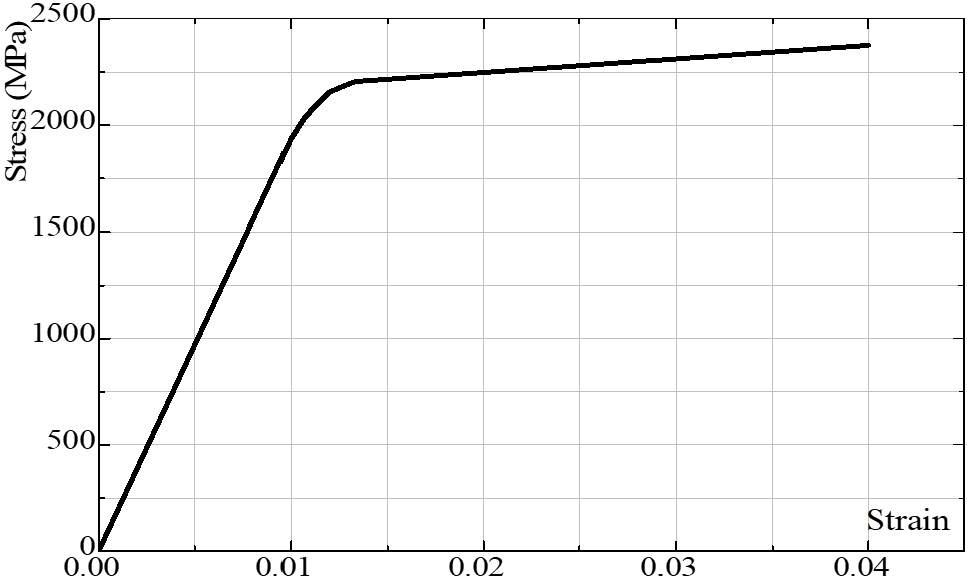
Previous section has shown the reliability and validity of the proposed model. Based on the calibrated stress-strain curve and the validated numerical model, this chapter investigates flexural behavior and estimate the loading capacity of 72m UHPFRC pre-stressed box girder. This bridge is a part of Busan Eco Delta City project, which has 72m span. Elevation view of 1/2 UHPFRC box girder and typical cross-section are presented in Figs. 9 and 10. The main structure of this bridge is pre-stressed box girder made of UHPFRC 150MPa compressive strength. The width of deck slab is 6.0m consists of 3box girders with the smallest height of 0.75m and the largest height of 2.6m. A girder consists of 5 segments with a total weight of 240 tons, are made in the factory of CRD company. Each box girder has 3 pre-stressed tendon clusters containing 24 strands of 15.2mm diameter SWPC 7D for a cluster. SWPC 7D is a high strength pre-stressed wire which has yield stress 2400MPa. Fig. 11 shows the assumed stress-strain responses for SWPC 7D tendon. When the strain is less than 0.01mm/mm, the response of the tendon is assumed to be elastic. However, as the strain exceeds 0.01mm/mm, the strand begins yielding and exhibits a reduced stiffness until it fails at its ultimate capacity of 2400MPa. A tendon cluster will be pre-stressed equivalent to 5992kN of axial force. Normally, the structure of larger span girder and deck is be designed by using horizontal and vertical steel bars to ensure the loading capacity. However in this UHPFRC girder, a noticeable feature is the deck and main structure has no steel bar. Moreover, thin wall, thin upper and lower slab are utilized.
3.2 Finite element model description
Element model: in the ABAQUS model, 3D linear truss(T3D2) element is used to model the steel rebar. This element is to model slender, line-like components with only axial loading along the element. It means the moment doesn’t occur in this element. The linear 3D brick reduced integration element(C3D8R), which can capture the crushing in compression and cracking in tension is chosen to model solid elements(Dassault Systèmes Simulia Corp, 2016).
Interaction between Concrete and Steel: in this girder, a very low reinforcement ratio is used, almost in connection detail. The interaction between non-prestressed steel bars and concrete element is assumed as a perfect bond. Based on this assumption, the nodes of steel element have displacement compatible with the nodes surrounding concrete elements. The embedded interaction in ABAQUS provides the property that can constrain translational degrees of freedom and embed truss element(T3D2) into solid linear brick element(C3D8R). The complicated anchorage of presstressed systems can be simplified and modeled by specified nodal constraints. The appropriate contact formulations is an effect approach of modeling PT prestressed systems and implemented in ABAQUS. The descriptions of the contact formulation in ABAQUS are on the basis of explicit dynamic analysis.
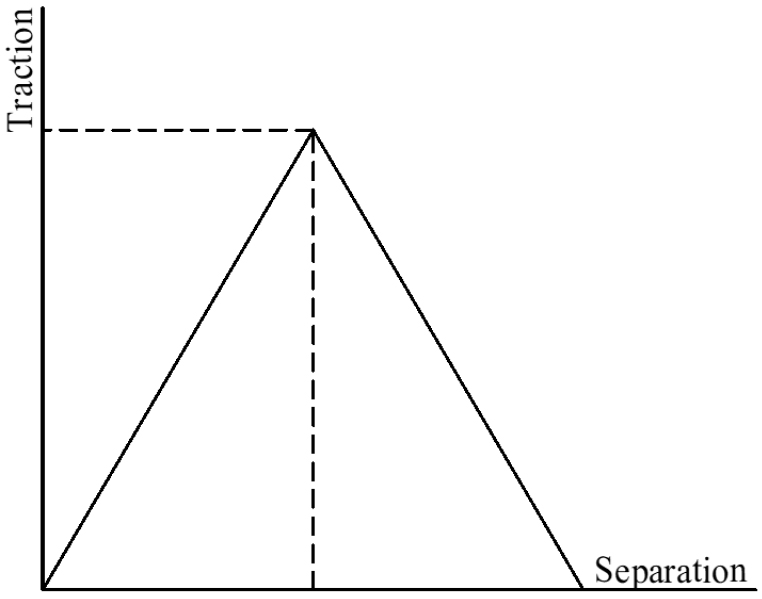
The interaction between strand and concrete is simulated using contact formulation. The composite action between strand and concrete includes slippage, friction, and temperature dependency. In this simulation model, interaction between strand and concrete is the surface to surface contact using tangential behavior combined with cohesive behavior property. The tangential behavior of the contact surfaces is represented by the coefficient of friction in FE. Based on AASHTO Bridge Design Specification, the value of friction coefficient f in the finite element model is 0.55(AASHTO, 2007). In ABAQUS, the discontinuity between the two states of sticking or slipping can result in convergence problems during the simulation. Therefore, a penalty friction formulation with an allowable elastic slip, has been adopted as in Fig. 12 ABAQUS automatically calculates the penalty stiffness and ensures that the allowable elastic slip does not affect the accuracy of the simulation model. For cohesive behavior, when the interface thickness is negligible, surface-based cohesion approach is recommended for its convenience and effectiveness. If the interface adhesive layer has a finite thickness and macroscopic properties (such as stiffness and strength) of the adhesive material are available, it is more appropriate to model the response using cohesive element approach. Since interaction between tendon and concrete does not have any interface layer therefore cohesive surface based approach has been utilized for the present analysis. The stress-slip relation to model the tendon-concrete cohesive behaviour in ABAQUS is implemented through factor knn, kss and ktt. Herrero et al. reported peak bond stress of 5.3MPa and slip as 0.8mm, corresponding to kss= ktt = 6.66N/mm and knn = 666.7N/mm(Vázquez-Herrero et al., 2013).
The mesh size is very sensitive for nonlinear analysis. Reduction in mesh size can result in more accurate results, however, it requires much time for the calculation process. After several attempts of calculating the model, the chosen mesh size of 40mm of the elements is appropriate to assure accurate results and saves analysis time. Totally, 77407 linear hexahedral elements of type C3D8R with 103006 nodes are created for the simulation model. Using advantage of the symmetric section, only half of the girder is modeled. In which, the Y direction is defined to model plane of symmetry. The roller support modeled provided constraints in the X and Y directions. The nonlinear analysis is implemented to investigate the concrete crack pattern from initial stage to failure stage. The load increment is given in a number of steps to achieve convergence. Table 2 shows the types of applied loads into the box girder.
Table 2
Applied loads into the simulation model
| Dead load | 7 | kN/m |
| Live load | 10 | kN/m |
| Wind load | 3.9-9.7 | kN/m |
3.3 Analytical resut
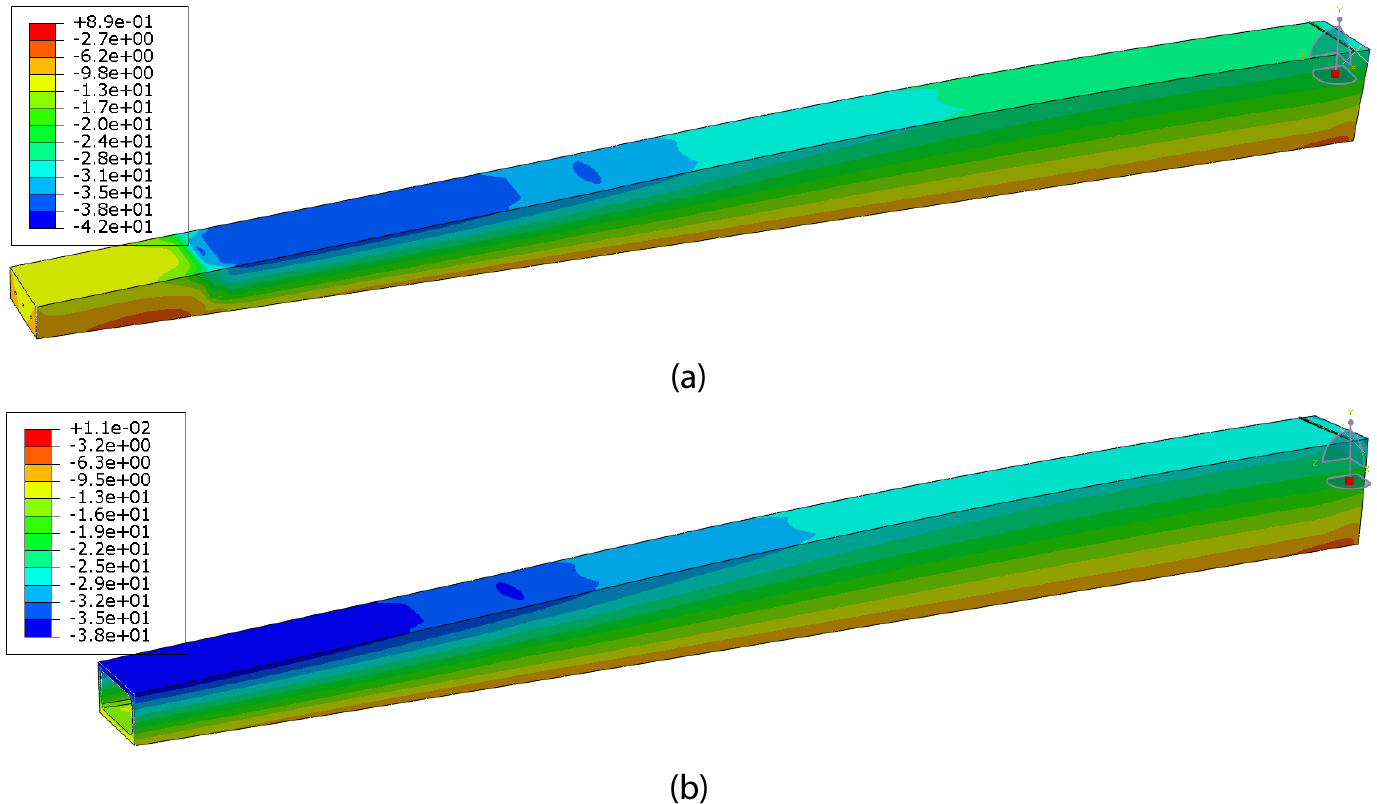
3.3.1 Stress result
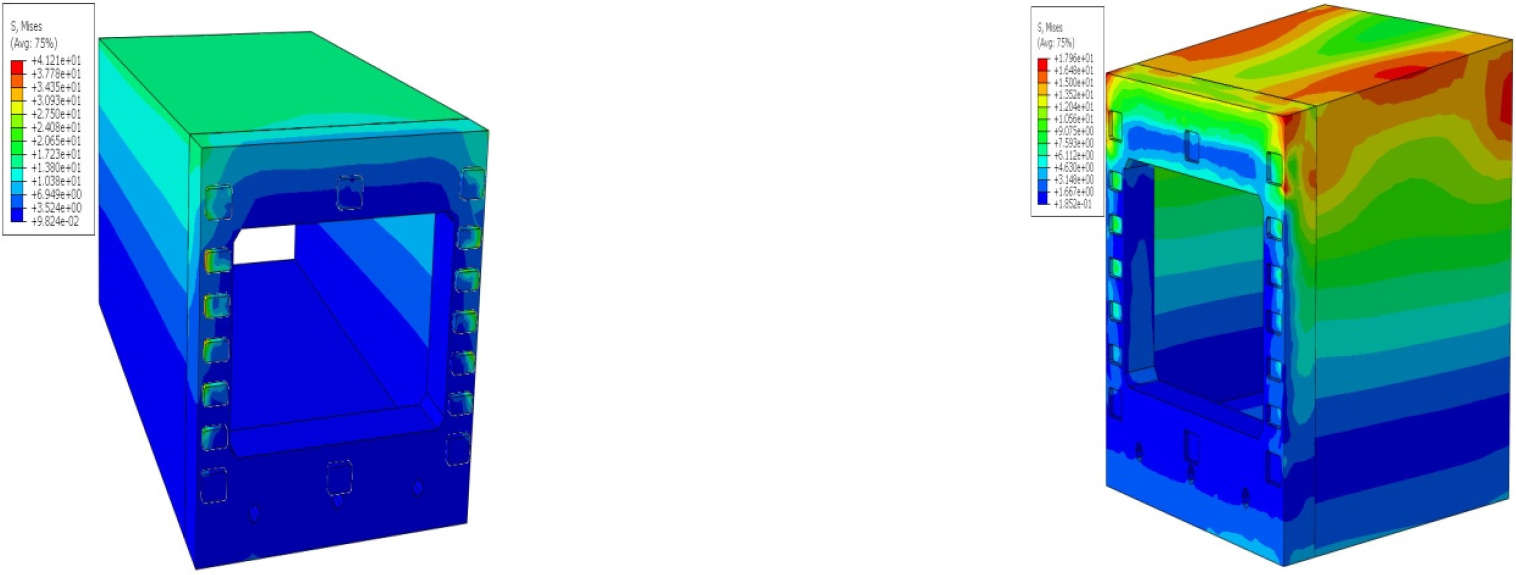
Fig. 13 show she stress of the box girder. The minimum stress of 42MPa(compression) is obtained at the 1-1 cross-section 5m from the support, which is the transitional part between the solid section and the box section of the girder. The limit compressive stress value specified in Korean design standards is 0.45 x fck = 67.5MPa, where fck =150 denotes the compressive strength of UHPFRC. The minimum stress of 42MPa in the box girder is remarkably less than the value of 67.5MPa demonstrates the safety of the girder.
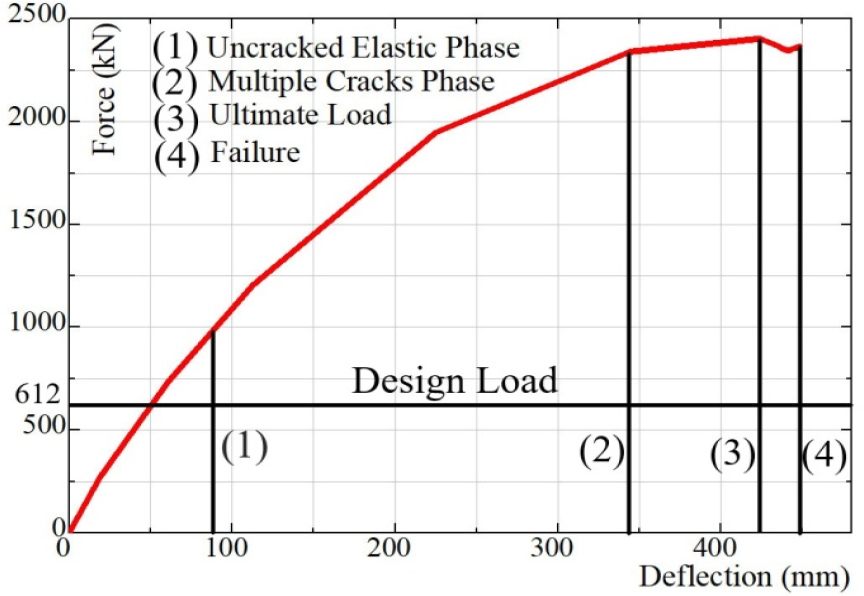
3.3.2 Load-Deflection Curve
Gradually increasing load on the surface of box girder to the failure state, the maximum load of 2365.7kN is observed by simulation analysis. The prediction load-deflection curve of the box girder is depicted in Fig. 14, containing 4 stages. The first stage starts from the first point to the load of 986.4kN, which is equivalent to nearly 41% of the maximum load. In the un- cracked elastic stage, the load-deflection curve exhibits elastic behavior. The finite element analysis shows the corresponding deflection of the box girder at the mid-span is 83.5mm. In the next stage, the load-deflection curve shows the nonlinear behavior. Cracks appear on the bottom face of the girder and multiple cracks begin to propagate. This stage corresponds to the strain- hardening behavior of the material. The load and deflection at the end of this stage are 2340.6kN and 344.1mm, respectively. In the third stage, a load from 2340.6kN to 2365.7kN is observed. The load-deflection curve exhibits the plasticity behavior, where the applied load increases slowly compared to other stages, but deflection keeps increasing rapidly. This behavior could be attributed to the yielding steel and crushing of concrete material. The ultimate load is 2365.7kN corresponding to the 423.9mm of deflection at the mid-span of the girder. In the last stage, the downward nonlinear behavior can be seen in the load-deflection curve. The failure load and deflection are 2270.3kN and 448.2mm, respectively. Maximum load of 2365.7kN is 3.8 times greater than design load of 612kN demonstrates the safety of UHPFRC box girder.
3.3.3 Shear stress capacity
The shear strength of UHPFRC element without reinforcement 𝜏 is obtained by summation of the shear strength provided by steel fiber() and cement matrix():
can be determined by the Eq. of C. Ţibea(Ţibea and Bompa 2020):
Kf is the global orientation factor of steel fiber, Kf =0.5- (0.645 / ) with =16 / 0.2= 80 is the ratio of length steel fiber over diameter. Then, Kf =0.5-(0.645 / 800.45)= 0.41. r f= 1.5% is the steel fiber volume. denotes the bond performance of embedded fibers. . fc1/2=0.9.1501/2= 11(MPa) where = 0.9 is the parameter for straight steel fiber and fc= 150MPa is the compressive strength. q is the angle occurring between axial direction and diagonal tensile crack plane. This angle shall be larger than 300. Take 𝜃=450 for this article. Substitute these values into Eq. (2), = 0.41. 80. 1.5%. 11. cotg450= 5.4(MPa). is shear strength of cement matrix, =f. 0.18. fc1/2= 0.77. 0.18. 1501/2= 1.7(MPa) with f=0.77 is the reduction factor. Finally, substitute and into Eq. (1), the shear strength per unit area of UHPFRC element 𝜏=5.4+1.7=7.1(MPa). This value is remarkably larger than maximum shear stress 3MPa from simulation result. Obviously, the UHPFRC cross section without steel reinforcement ensures the shear strength.
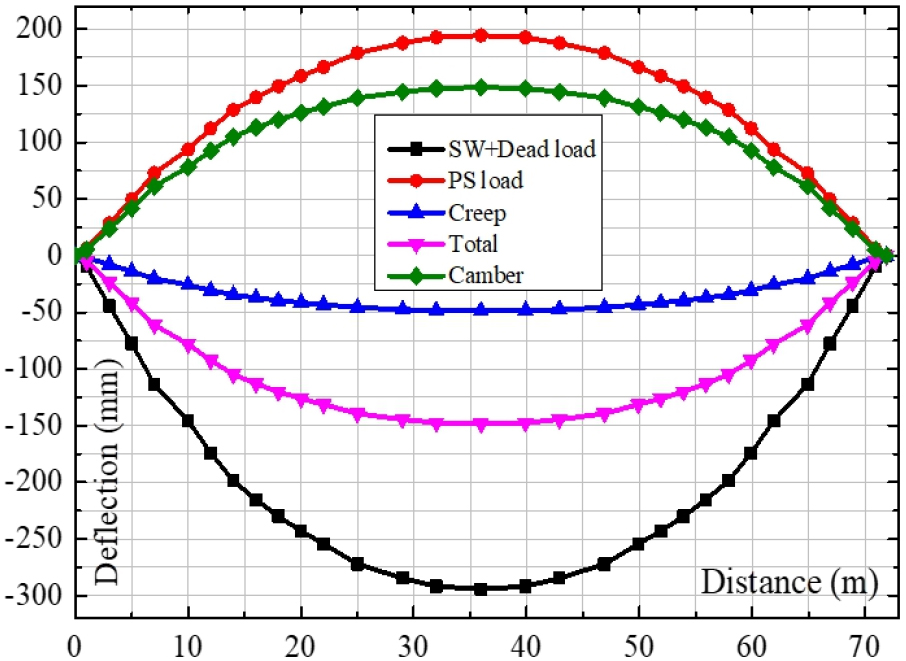
3.3.4 Camber analysis
The initial camber is occurred immediately after transferring pre-stressed force to tendons. The tensile force is applied to tendons resulting in compressive stress surrounding concrete. Consequently, bending moment occurs in the middle of the span leading to a camber at the mid-span of the girder. Creep coefficient for UHPFRC with heat treatment is 0.46(Zhu et al., 2020). Based on the collected data, the deflection value for creep is estimated after 10000days(approximately 30years). From the simulation model the downward deflection due to pre-stressing, self-weight, dead load and creep is determined in Fig. 15.
3.3.5 Shear key and connection detail analysis
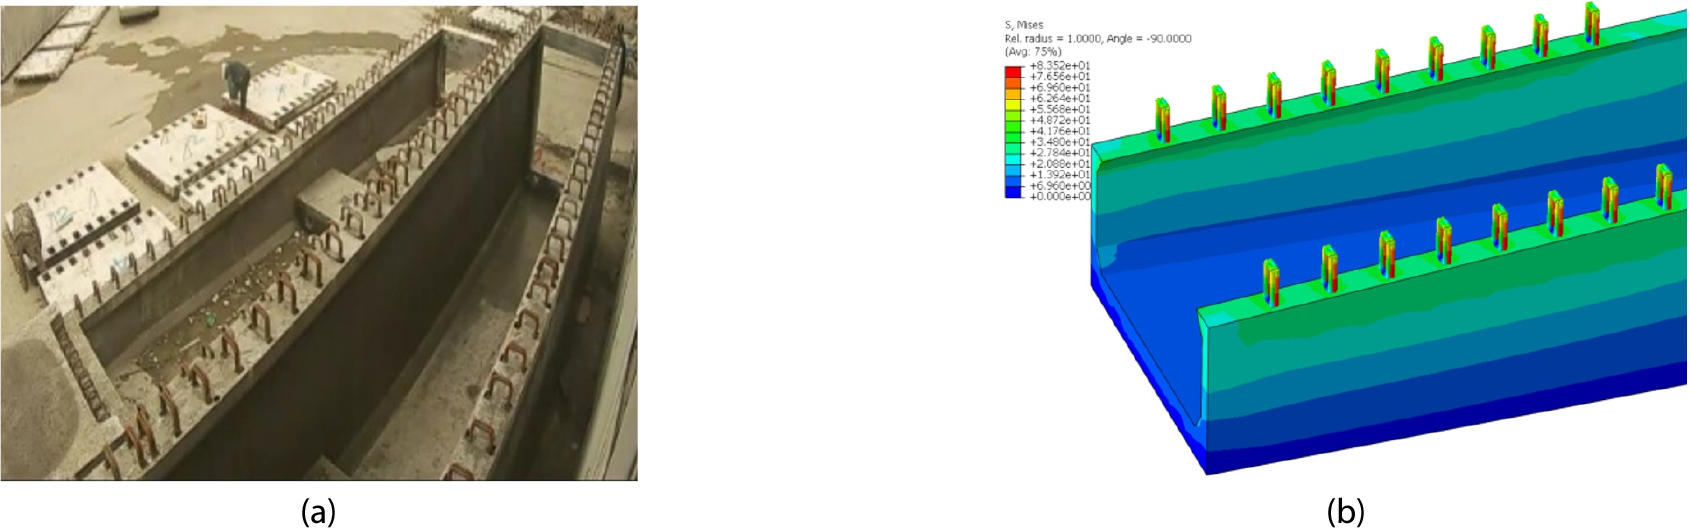
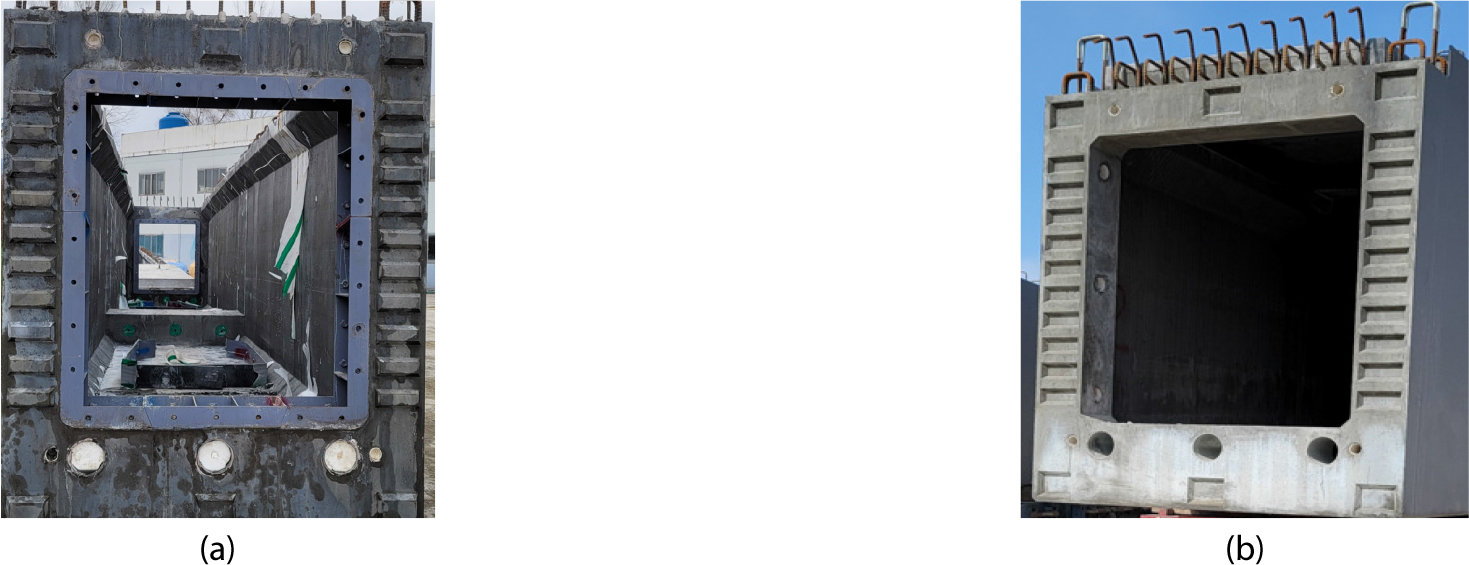
The deck of the bridge is constructed as the 3mx2m panels with holes(Fig.16a). Then, the panels are put into position and connected to the girder by grouting and two steel shear key D25. The simulation result of the connection detail 5m from left support is shown in Fig.16b. The maximum stress in the steel bar and concrete element is 83.5MPa and 43.7Mpa, respectively. Connection detail ensures the loading capacity.
Due to large length, girder must be divided and casted by different segments. Then these segments are assembled in the field. Prestressing force through the tendons and shear key keep these segment connected as one block. The segmental joints and its performance play the important role in the serviceability behavior of the segments in the girder. Figs.17a, 17b shows the concrete shear key detail. In the simulation model, to make the precise result and predict better the behavior of the contact area, seed sizes of 10mm is adopted to mesh the interface in the shear keys. Hard contact is chosen to describe tangential behavior with the friction coefficient of 1.44 for the rough surfaces(Hussein et al., 2016). Fig. 18 show the simulated stress surrounding the shear key at the distance of 14.3m and 28.6m from left support. The maximum stress values are 41.2Mpa and 17.9Mpa, respectively. These results demonstrate that the shear keys exhibit the adequate performance and no damage at contact interfaces are observed.
4. Conclusion
A simulation model of UHPFRC pre-stressed box girder for a 72m span pedestrian bridge structure is presented in this study. Following the reported agreement of the FE results with those obtained from the presented experimental study of 50m UHPFRC box girder test, the numerical model has been used to investigate the flexural behavior of 72m UHPFRC pre-stressed box girder. The important results can be drawn from this study:
1) The calibrated constitutive material curve demonstrates the effect to predict the flexural behavior of the 72m UHPFRC pre-stressed box girder. This curve combined with the CDP model can be applied to simulate other super structures using UHPFRC materials.
2) The comparison of the load-deflection curve under design load shows the loading capacity and safety of the slender cross-section without steel bar of UHPFRC pre-stressed box girder. Based on simulation data, loading capacity of box girder is 3.8times larger than design load.
3) Calculation shear stress of box girder’s web without stirrup under the design load is smaller than the shear stress capacity of experimental equation combined by steel fiber and concrete matrix. Slender cross-section design of UHPFRC box girder is demonstrated to resist external shear force.
