

1. Introduction
Defects on metallic reinforcements and cables are major threats to aging infrastructures. The Defects cause great reduction in strength which leads to collapse of the structures. Among different types of defects, corrosion greatly affects the health of the structures. In case of prestressed concrete(PSC) structures, narrow margin between yielding and rupture of the strands can cause a corroded pre-stressed element to suddenly fail without exhibiting any sign of deterioration(Mangual, Elbatoanouny, Ziehl, and Matta, 2013). To prevent such events and dangers, detecting defects in advance is extremely important.
While visual inspection is the most effective way to assess a structure, internal defects located on the surfaces of reinforcements and cables encased by exterior covers are difficult to detect. Regardless of its limitation, assessment of bridges and structures are generally conducted with the visual inspection. When defects are exposed and visible with unaided eyes, it means that the defects have already become a major threat to health of a structure, and corrosion have already spread out inside of the structure.
As a result, several indirect non-destructive corrosion detection methods such as thermography, magnetic flux leakage method, acoustic emission method, and ultrasonic guided wave method have been developed to prevent strcutres from collapsing(Ciolko and Tabatabai, 1999). In the present work, reflectometry, commonly used in electrical engineering field to detect discontinuities in power cables, is adapted in civil engineering to detect defects on metallic reinforcements and cables. The method involves sending an electrical pulse along metallic reinforcements and observing the echoes. Any defects will cause a reflection, and from the transit time, magnitude, and polarity of the reflection, spatial location or size of the defects can be measured and determined. The developed method in this research is different from the other NDE methods in manner that an input electrical signal can be instantaneously generated and received at the same end of a structure to be analysed; therefore, the detecting process becomes much simpler compared to that of the other methods.
In this research, a couple of experiments were conducted to verify the possibility of adapting the reflectometry method in assessment of structures. And simulation of the experiments were conducted using commercially available program called COMSOL. COMSOL program can support various governing equations, and in the presenrt research, Radio Frquency(RF) module that can be used to calculate electromagnetic wave propagation, electromagnetic field distributions, transmission, impedance, and etcetera was used.
Results of the simulations were compared to that of laboratory experiments to verify the accuracy of the simulation. When feasibility of the modeling is confirmed, whether the detecting method can be used on any structure will be determined prior to any physical tests by modeling the structure with COMSOL in the future. And limitation of conducting real-scale experiments due to difficulty in making a real-scale civil structures will be compensated.
2. Methodology
In this chapter, theory of transmission line adopted in the NDE method will be discussed. Then, procedure of adopting the NDE method into civil engineering field will be listed.
2.1 Transmission line theory
Based on Transmission Line theory, power is delivered from a source to a load. The theory represents a line with a distributed parameter equivalent circuit and wave propagation in terms of voltage and current(Pozar, David M, 2012). The distributed parameter equivalent circuit of a transmission line is shown in Fig. 1.
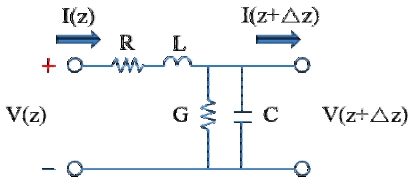
The distributed parameter equivalent circuit contains a uniformly distributed series resistance, R, series inductance, L, shunt capacitance, C, and shunt conductance, G. Resistance represents the decrease in voltage through a conductor; Inductor represents the magnetic field created by flowing current; Conductance represents the leakage current; and Capacitance represents the ratio of change in voltage to change in electric field. A transmission line is assumed to be infinite series of distributed parameter equivalent circuit as shown in Fig. 2.
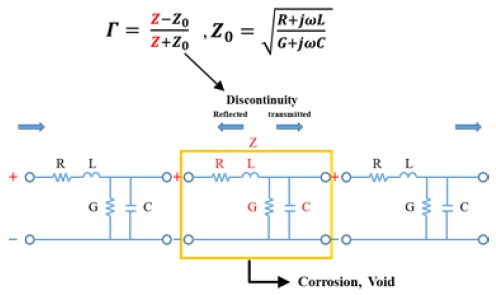
At every point signal crosses, the transmission line theory equation must be obeyed; however, when discontinuity in a transmission line occurs due to changes in any of R, L, C, and G, a reflection is generated as shown in Fig. 2. The ratio of reflected voltage to the incident voltage is defined as voltage reflection coefficient, rho, and is related to Zl and Zo as shown in Eqn. 1(Liu et al., 1999).(2)
Here, Zo is the characteristic impedance of the line.
Using this property, the transmission line theory was utilized in the developed NDE method.
2.2 Reflectometry
Time Domain Reflectometry(TDR) is an electrical measurement technique that involves sending an electrical pulse generated from arbitrary waveform generator(AWG) along a transmission line and using an oscilloscope to observe the reflecting signal returning back from any discontinuities. For TDR, AWG generates a fast rising step wave or pulse.
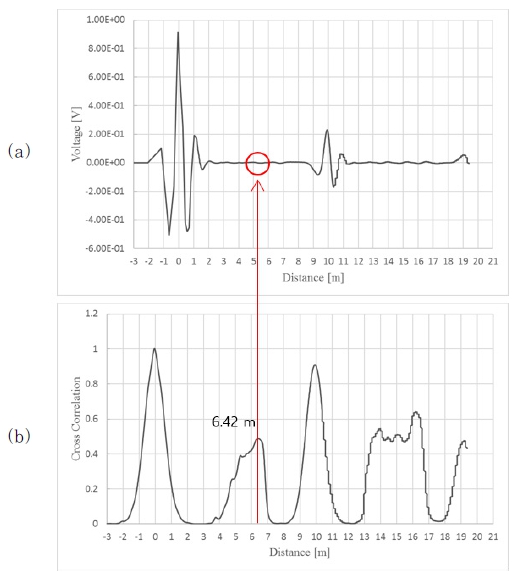
Time-Frequency Domain Reflectometry(TFDR), on the other hand, can determine the spatial location and size of the defects(Shin et al., 2005). TFDR method captures advantages of TDR and FDR; therefore, Unlike TDR and FDR method, reference signal of TFDR can be optimized based on the properties of objects being analysed. Reflected signals are usually small that it is not visible; therefore, a post processing is required. Post processing requires calculating the cross-correlation value of inputted and reflected signals and converts the value into a numerical value between 0 to 1, 1 indicating the most similarity. Any cross-correlation values under 0.2 refer to noises. Fig. 3 shows that even if a reflected signal is not visible in the inputted and reflected signal graph(Fig. 3(a)), it is visible in the cross-correlation graph(Fig. 3(b)).
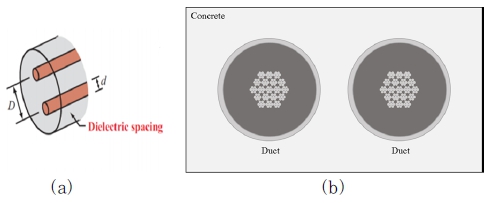
Transmission line theory is adopted in the detecting method to locate defects such as corrosion on prestressing strands and voids inside of PSC ducts. In order to adopt transmission line theory as an NDE method, some assumptions were made. First, prestressing strands and ducts inside of PSC structures have to be considered as transmission lines. Different types of transmission line are coaxial cable, two-wire line, parallel-plate line, strip line, micro strip line, and etc. Among different types of transmission line, two-wire line can be used to depict PSC ducts of PSC structures. Two-wire line can be compared with the two ducts inside of a PSC bridge. As shown in Fig. 4(a), two-wire line has two circular conductors separated in distance, D. And two ducts in a PSC bridge shown in Fig. 4(b) can be compared to the two-wire line.
From the facts that TFDR, a method often used in electrical engineering field, can be adapted as a nondestructive evaluation of structures and even a small reflection can be detected through the post processing of cross-correlation calculation using TFDR, a new method adating TFDR was developed in this research.
3. Experiment and simulation
In this chapter, experiment set-ups and corresponding modeling using COMSOL will be explained. In modeling, because skin depth effect of steel can be neglected, two steels were modeled in perfect electric conductor which means that conductivity on the boundary is infinite, and resistivity is zero. And for the end surface of the steels, perfect magnetic conductobr(PMC) boundary condition was applied, meaning that current cannot flow beyond this point. This is equal to open condition of a circuit. A electrical signal will be reflected on the open boundary condition.
3.1 Defect on a seven wire strand
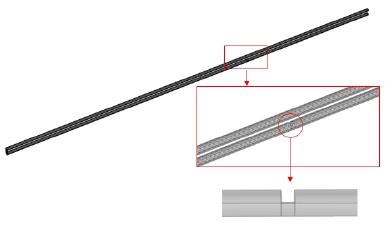
First, an experiment was conducted to see if the developed method can detect any defects. Two 10 meter seven wire strands were placed in parallel where a defect was manipulated in one of the two wires. The defect was manipulated by reducing its cross-section by half. Fig, 5 depicts the experiment setting. Electrical signals were designed according to the geometry and electrical characteristics and were inputted via the TFDR system. The signals were reflected from the defect and the end point as depicted in Fig. 5 as arrows.
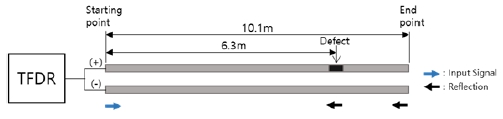
Fig. 6 shows the simulation modeling of the laboratory experiment. As shown in Fig. 6, at 6.3m, cross-sectional area of one strand was reduced by half to see a reflection, corresponding with the actual experiment, will be made.
3.2 Corrosion on a seven wire strand
After conducting the experiment on detecting the defect, which is the reduction in the cross-sectional area, using the developed method, another experiment was conducted. This time, purpose of the experiment was to detect corrosion, made on one of the strands. The corrosion was quantified based on the accelerated corrosion test using impressed current technique(El Maaddawy and Soudki, 2003). Fig. 7 depicts the experiment setting.
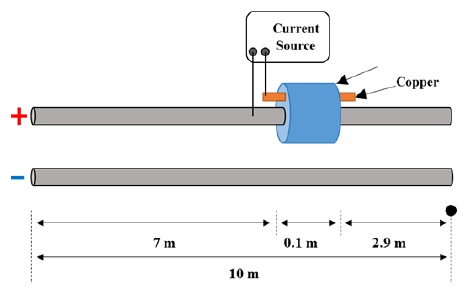
Change in Impedance was measured even before corrosion because of the experiment apparatus such as current source, copper, and cotton. Therefore, in this experiment, change in the reflected signals were measured. Accordingly, reflected signals after 0, 10, and 20 hours of corrosion generation were obtained and compared to each other to confirm the effect of corrosion on reflected signals.
4. Results
Here, results of experiments and simulations are shown and compared to confirm the performance of the developed method and feasibility of COMSOL simulation.
4.1 Defect on seven wire strands
The results are shown in Fig. 8. While reflected signal is not visible in Fig. 8(a), a large crosscorrelation value representing a defect is visible at 6.2m. The developed method had detected the defect 0.1m off from its actual location; however, this error is not significant since the error can be reduced by adjusting the inputted signal. And when finding a defect in actual structure, large area of concrete cover has to be removed in order to replace corroded reinforcements that a defect can be found with such slight error in detection.
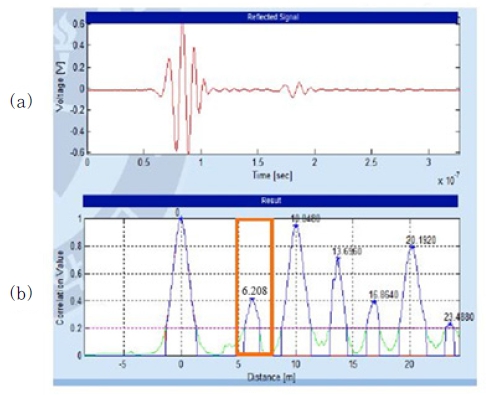
Fig. 8
Experiment results: (a) Voltage graph of the defect detecting experiment; (b) Cross-correlation graph of the defect detecting experiment
Fig. 9 shows the simulation results. Reflection was measured around 6.42m meaning that the reduction in area has caused the reflection.
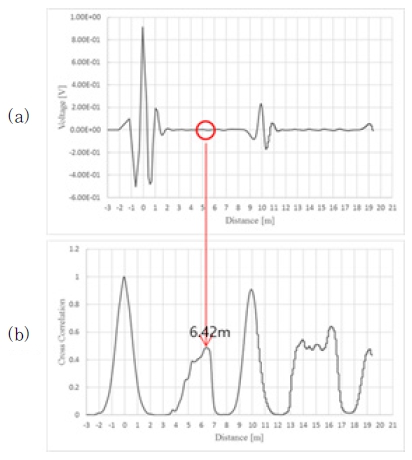
Fig. 9
Simulation results: (a) Voltage graph of the simulation; (b) cross-correlation graph of the simulation
Therefore, the experiment and simulation were both successful in achieving their goals of finding defects.
4.2 Corrosion on seven wire strands
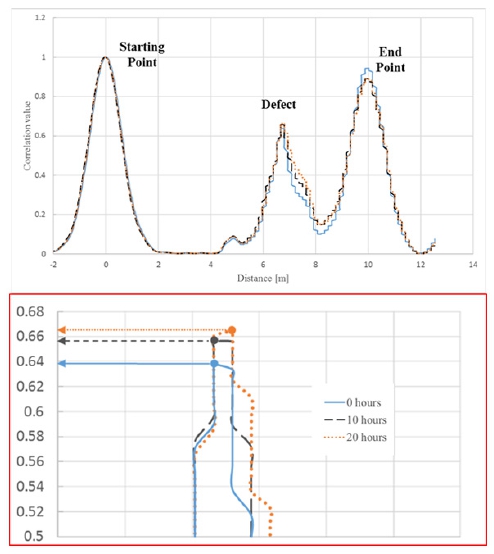
Fig. 10 shows the three obtained reflected signals at 0, 10, and 20 hours after the start of the experiment. As can be seen from the Fig. 10, cross-correlation value at the location of corrosion increased along with time, meaning that the size of reflection increased due to the increase in degree of corrosion.
In simulation, however, because electrical properties of materials such as cotton that absorbed 5% NaCl water or impedance change due to geometric change by cotton were difficult to obtain, Further study on the electrical properties of various metarials are required.
5. Conclusion
In this study, a method for detecting defects such as corrosion and voids inside of a PSC duct by adapting electrical signal methods was developed and introduced. The developed method utilizes timefrequency domain reflectometry(TFDR). To confirm the accuracy of the method, a couple of experiments were conducted in the laboratory, and the experiments were simulated using COMSOL. The results of the experiments showed possibility of the method to be used in actual structures by detecting the manipulated defects. And because simulation results well matched with the experiment results, accuracy of the simulation was also confirmed. Further researches such as assessing larger structures and study of electrical properties of different materials for simulation can be made in order to further develop the new NDE method.
